

FROM THE EDITOR
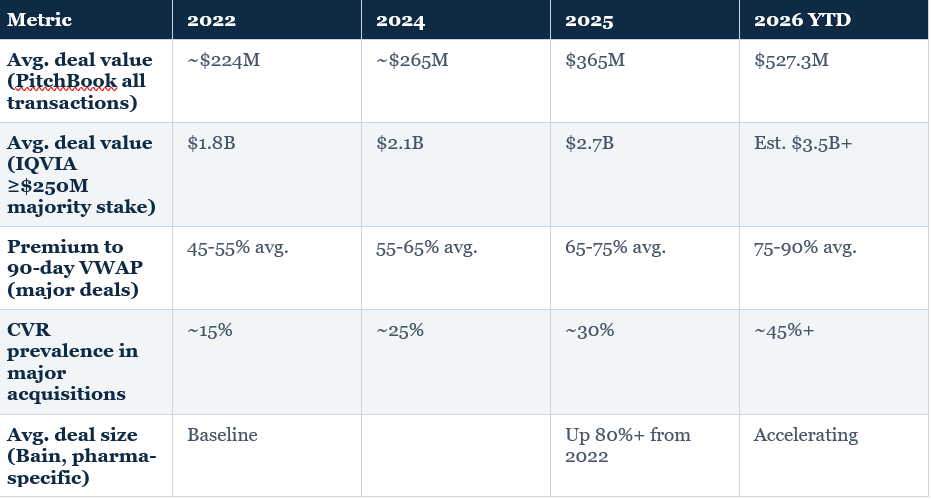
The average biopharma deal value has jumped from $365 million in 2025 to $527.3 million in 2026 . That’s a 44% increase in a single year, in a market already running at record pace. Biogen paid 86% over the 90-day VWAP for Apellis. Lilly paid $7.8 billion for a Phase 2 sleep disorder drug. Merck bought three companies in ten months, each for at least $6.7 billion. This is not a pricing anomaly. It is a structural shift in how pharma M&A premium is determined — and it has specific, concrete implications for the legal documents that govern these transactions.
This issue does three things. First, I want to identify the five specific forces driving premium inflation in 2026 — not in abstract market terms but in the specific mechanisms that are causing the number to move. Second, I want to name precisely who gets squeezed in a high-premium environment — because it is not the sellers, and it is not primarily the large strategic acquirers. It is a specific set of market participants who are being systematically disadvantaged by the premium environment, and the CLO who understands this can advise the relevant board accordingly. Third, I want to trace the legal implications of premium inflation — specifically how high premiums change the deal structure, the CVR prevalence, the reps and warranty insurance dynamics, and the post-closing integration risk.
Premium inflation is not a market curiosity. It is a change in the legal economics of pharma M&A.
— John LaRocca
Founding Editor | LaRocca Advisory Services
The Baseline: What $527.3 Million Means
$527.3 million. That is the average biopharma deal value through the first week of June 2026, according to PitchBook data reported by CNBC. Against the $365 million average in 2025, that is a 44.3% increase. Against the $224 million average in 2023, it is a 135% increase over three years. Against any reasonable definition of normal biopharma deal pricing, it is a market that has repriced itself fundamentally in a short period of time.
The $527.3 million average requires a methodological note. This figure comes from PitchBook’s all-transactions dataset — 201 deals across all deal sizes through early June. The IQVIA dataset, which uses a higher threshold (≥$250 million, majority stake acquisitions only), produced a $2.7 billion average for 2025. These are not comparable — they measure different populations. The PitchBook figure is more useful for understanding the full market distribution; the IQVIA figure is more useful for understanding large-transaction dynamics. Both show the same directional trend: premiums are higher, deal values are higher, and the market has decisively moved away from the 2022-2023 trough.
The Five Drivers of Premium Inflation: The Mechanism Behind the Number
The 44% jump in average deal value is not a single phenomenon. It is the aggregate output of five distinct forces operating simultaneously. Each has specific legal implications for how deals are structured, documented, and executed.
DRIVER 1: Patent Cliff Urgency Creates Non-Negotiable Demand
Mechanism: When a blockbuster drug faces LOE within 3-5 years, the acquirer’s financial model changes fundamentally: the cost of not acquiring is greater than the cost of overpaying. A company facing $10 billion in annual Keytruda revenue at LOE risk will rationally pay $7 billion for a de-risked replacement asset that generates $2 billion annually — the NPV of 5 years of Keytruda revenue dwarfs any acquisition premium.
Evidence: Merck’s three acquisitions in 10 months (each ≥$6.7B) are the clearest expression of LOE-driven urgency. AbbVie ($33.6B remaining capacity), BMS ($21.9B), and Amgen ($18.6B) face comparable LOE dynamics over the 2027-2030 period.
Legal Implication: LOE-driven acquisitions produce higher acquisition premiums in the merger agreement because the acquirer’s break-up fee exposure and reverse termination fee structure reflect their desperation to close. A seller’s counsel in an LOE-driven deal has genuine leverage in the deal protection negotiations. MAE definition, operating covenants, and closing conditions should all be negotiated with the acquirer’s urgency as explicit context.
DRIVER 2: Scarcity of De-Risked Phase 2/3 Assets
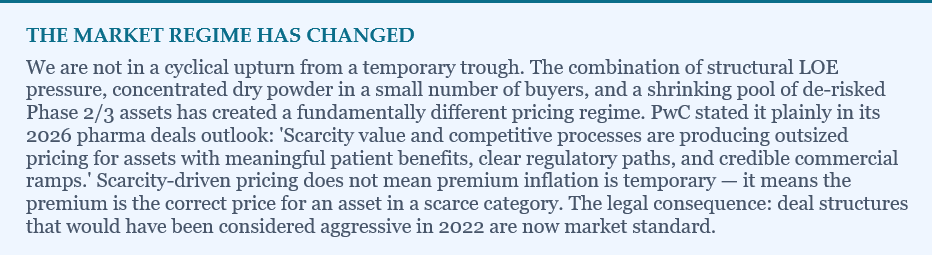
Mechanism: The pool of assets that simultaneously have (a) Phase 2 or later clinical data, (b) a differentiated mechanism, (c) a credible regulatory path, and (d) a large addressable market is genuinely small relative to the number of acquirers seeking them. PwC described the result: ‘Scarcity value and competitive processes are producing outsized pricing.’ This is not a narrative; it is supply-demand economics applied to a category with a finite supply.
Evidence: 24 transactions in the first 4 months of 2026 with upfront values exceeding $64 billion, versus 14 deals/$24.5B in the same period of 2025. 19 deals of $1B+ announced between January 1 and April 7 alone (Stifel). The rate of deal formation is outpacing the rate of asset de-risking.
Legal Implication: Scarcity-driven auctions produce compressed timelines, limited diligence windows, and pressure to accept seller-favorable representations. The CLO on the buy side in a competitive auction must have pre-built diligence frameworks that can be executed in 3-4 weeks without sacrificing material coverage. The RWI underwriting process must be initiated before the bid deadline, not after exclusivity is granted.
DRIVER 3: Competitive Bidding Structures in a Multi-Buyer Market
Mechanism: The 2026 M&A market is characterized by multiple simultaneous large-cap acquirers competing for the same quality assets. When Novartis, AbbVie, BMS, and Amgen are simultaneously evaluating the same Phase 3 oncology program, the clearing price is determined by the most aggressive bidder’s LOE calculus, not by any fundamental asset value. Competitive tension in auction processes mathematically produces prices above intrinsic value.
Evidence: The Biogen/Apellis premium of 86% to the 90-day VWAP; Lilly/Centessa at a substantial premium to prior trading; the reported $28-32B evaluation range for Revolution Medicines. These are not isolated; they reflect systematic competitive bidding across the asset pool.
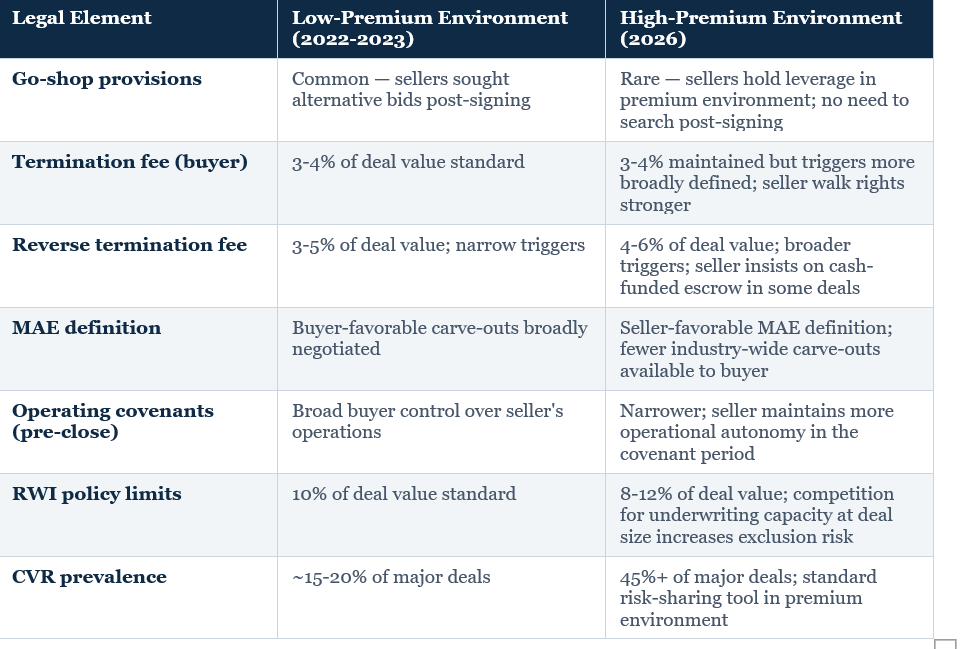
Legal Implication: Competitive auction processes produce merger agreements with seller-favorable closing conditions, limited buyer walk rights, and aggressive deal protection mechanisms. Fiduciary termination fees (go-shop provisions) are becoming less common as sellers recognize they hold the leverage. The CLO who negotiates closing conditions in a competitive auction should expect to accept materially fewer out clauses than in a bilateral process.
DRIVER 4: CVR Structures Inflate Headline Price Without Full Capital Deployment
Mechanism: The prevalence of CVR structures — 45%+ of major deals in 2026 — inflates the headline deal value without requiring the buyer to deploy the full consideration at closing. A $7.8B deal headline ($6.3B upfront + $1.5B CVR) represents only $6.3B of certain capital at risk. CVR structures allow buyers to compete on headline price while managing actual capital deployment. This contributes systematically to headline average deal value inflation that does not fully reflect economic consideration paid.
Evidence: Three of Q1 2026’s major deals included CVRs: Lilly/Centessa ($1.5B), Biogen/Apellis ($4/share), Novartis/Pikavation (implied milestones). BMO noted that 3 of the last 5 deals before mid-year included a CVR.
Legal Implication: CVR structures produce legal complexity that outlasts the deal itself. As described in Issue 5, the CVR agreement’s milestone definitions, calculation mechanics, development obligation standards, and dispute resolution provisions determine whether the CVR consideration is paid or litigated. Headline deal value is not the same as total consideration actually delivered. It’s the legal team’s job is to ensure the CVR provisions are drafted so that the distinction is minimized.
DRIVER 5: China-Origin Asset Bidding Drives Upward Comparables
Mechanism: The entry of China-based pharmaceutical companies as both buyers and sellers in the global biopharma M&A market — at values that reflect Chinese pharma’s cost structure and the strategic importance of ex-China rights — has produced a new set of valuation comparables that are resetting price expectations globally. The $15.2B Hengrui-BMS partnership and $10.5B Innovent-Pfizer collaboration create valuation anchor points that inform how Western pharma companies price comparable assets.
Evidence: In 2025, 40% of all assets in-licensed by big pharma had a Chinese licensor (up from 30% in 2024). Aggregate value of China-origin therapeutic deals more than doubled from $45B in 2024 to $105B in 2025. China is no longer a peripheral source of innovation — it is a primary valuation anchor.
Legal Implication: China-origin deals create a legal complexity bundle addressed in Issues 4 and 5: IP chain of title across CNIPA and USPTO, manufacturing site regulatory risk, export control compliance, and CFIUS analysis for acquisitions. At the valuations now being paid for China-origin assets, incomplete diligence on these dimensions creates material post-closing liability.
Who Gets Squeezed: Three Categories of Market Participants Disadvantaged by Premium Inflation
Premium inflation benefits sellers. It does not uniformly disadvantage all buyers. The specific market participants who are being systematically squeezed by the 2026 pricing environment are:
Squeezed Category 1: Mid-Cap Strategic Acquirers in the $2B–$15B Revenue Range
The current deal market is being made by companies with revenues above $15 billion and acquisition capacities above $5 billion per deal. For mid-cap specialty pharma companies with $2-15 billion in annual revenue and $500 million to $3 billion in acquisition capacity, the premium environment is genuinely dislocating. These companies have the strategic rationale to acquire the same de-risked Phase 2/3 oncology and CNS assets as Merck and Lilly, but they cannot match the financial firepower that is setting the clearing price. The strategic implication: mid-cap acquirers are being crowded into either the earlier-stage risk (Phase 1/2 assets where premiums are lower but clinical risk is higher) or the commercial-stage product categories that large pharma is not prioritizing (where premiums are lower but growth is also lower). Neither is a fully satisfying alternative to the deal the company actually wanted.
The legal implication for the CLO at a mid-cap strategic: the company’s M&A strategy needs to be explicitly recalibrated around where it can compete — not where the market’s headline deals are being made. The board conversation should be direct: at current premium levels, which assets in the target list can this company realistically acquire? Where does the financial model break even at the required premium? The CLO who delivers this analysis with specificity is doing their job.
Squeezed Category 2: PE-Backed Specialty Pharma Platforms (Buying)
As analyzed in Issue 7, PE-backed specialty pharma platforms face a structural disadvantage in the current deal market as buyers. The $527.3 million average is being set by transactions that PE-backed platforms typically cannot fund at required IRR thresholds. The premium environment is not just inconvenient — it is a strategy-forcing constraint. At a 45% increase in average deal price in a single year, the return model for a PE specialty pharma platform that was calibrated to 2025 pricing is materially broken for 2026 pricing.
The legal implication for PE-backed platforms: every acquisition thesis presented to the investment committee needs to be stress-tested against the premium environment, not calibrated to it. An asset acquired at 2026 premium pricing, with a 2025 exit multiple assumption, produces returns that do not clear the fund’s hurdle rate. The CLO who models the post-close legal costs — integration, regulatory compliance, employment, Section 232 tariff exposure — provides the data that makes this stress test credible.
Squeezed Category 3: Later-Stage Biotechs That Are Not Acquisition Targets
The premium environment benefits biotech companies that are being acquired. It does not benefit biotech companies that are not being acquired but are trying to compete for the same scientific talent, clinical resources, CDMOs, and investor attention as the companies generating headline premiums. The 2026 deal wave is concentrating attention and capital on a small number of categories (ADCs, orexin, GLP-1 adjacencies, multispecifics). Biotechs operating in less-fashionable categories — traditional small molecules, mature biologics, infectious disease outside specific categories — are watching the premium environment create wealth for their peers while their own valuations stagnate.
The legal implication for the CLO at a later-stage biotech in a non-premium category: the company may need to evaluate whether a licensing deal for its lead program creates more value than continuing to operate independently. The premium inflation environment has created a specific type of licensing market — where a strategic acquirer will pay for the right to a specific asset at prices that reflect the asset’s strategic value to the acquirer, not the biotech’s go-it-alone valuation. A licensing deal that delivers $200 million upfront and $500 million in milestones for a single program may be a better outcome than a 5-year path to a $400 million acquisition.
The Legal Structure Consequences of Premium Inflation: Four Direct Effects
Premium inflation is not just a financial phenomenon. It changes the legal structure of deals in four specific ways that the CLO needs to anticipate and manage:


Know a GC, CLO, or finance leader who’d find this useful? Forward it — genuinely, that’s how The GC Playbook grows.
And if your team has a raise, sale, or audit on the horizon, I take on a few diligence & compliance readiness reviews a year. Just reply to this email.
John (john@laroccaadvisory.com)
