

FROM THE EDITOR
The first half of 2026 is over and the number that matters most is this one: $130 billion. That is IQVIA’s H1 2026 aggregate biopharma M&A deal value across 42 transactions. The full-year 2025 total was $133 billion. In six months, this market has essentially matched what it did in all of last year. If you include licensing deal value — which JP Morgan’s H1 report puts at $166.7 billion in announced R&D value — the scale of capital deployment in the first two quarters of 2026 is without recent precedent.
In our June 22 analysis, I wrote that this market was on track for $250 billion and that the deal engines driving it — patent cliff urgency, aligned biotech valuations, concentrated dry powder — showed no sign of stalling. The H1 close confirms that analysis. What it adds is something I did not fully anticipate in June: the acceleration was not evenly distributed across the half. Q2 nearly doubled Q1 in both deal count and value, and five of the year’s largest single transactions — all $10 billion or more — were announced in Q2 alone. The market did not just sustain its Q1 pace. It accelerated into it.
This issue is the mid-year assessment. I want to tell you what the H1 record means, what drove the Q2 surge specifically, what the IPO market data alongside the M&A data tells us about the health of the capital ecosystem more broadly, and what July through December looks like from where I sit on July 6. The Section 232 Annex III tariff deadline hits for 17 companies in 25 days. The Revolution Medicines evaluation is still live. The H2 deal pipeline is real. But so are the headwinds.
The record is set. The question is what comes after a record.
— John LaRocca
Founding Editor | LaRocca Advisory Group
H1 2026 Mid-Year Review: The Record Is Set. What Comes After a Record?
The Numbers: What H1 2026 Actually Produced
Before drawing conclusions, the data deserves honest presentation. Multiple datasets cover the same period and produce different figures, because they use different scope definitions and deal inclusion criteria. All are legitimate; they are measuring different things.
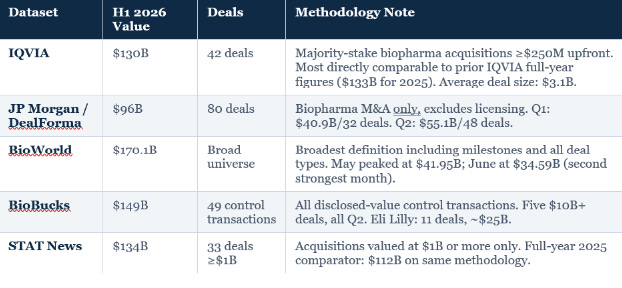
The IQVIA figure ($130B across 42 deals) is the most useful comparator for this newsletter because it is methodologically consistent with the full-year 2025 total of $133 billion that has been the series’ benchmark. On that basis, H1 2026 has already delivered 98% of 2025’s full-year value in six months.
The Q2 Surge: Why the Second Quarter Nearly Doubled the First
The Q2 acceleration is the single most important data point in the H1 review, and it deserves specific attention because it was not evenly distributed across the quarter or across acquirers.
The $10B+ Concentration
Five transactions of $10 billion or more were announced in Q2 alone. On the BioBucks dataset — which covers all control transactions with disclosed value — those five deals accounted for approximately $97 billion, or roughly two-thirds of all H1 disclosed value, from just over 20% of the transactions. This is a market in which a small number of very large deals are carrying most of the aggregate value. It means that the headline $130 billion or $149 billion figure is not reflective of broad-based dealmaking across the industry. It reflects a specific set of large cap strategic buyers making very large bets.
Eli Lilly’s Pace
Eli Lilly announced 11 deals in H1, totaling approximately $25 billion. That is not a typo. One company, 11 transactions, $25 billion, in six months. The Centessa acquisition ($7.8 billion) is the largest single transaction, but the remaining ten deals span ADC platforms, metabolic disease, CNS, and rare disease programs across multiple deal structures. No other acquirer in this market is deploying capital at Lilly’s pace, and no other acquirer has demonstrated this range of therapeutic area coverage simultaneously. From a legal infrastructure standpoint, managing 11 concurrent or sequential deal processes requires a legal function that has pre-built every system this newsletter has described across the prior ten issues: HSR readiness, cross-border deal capability, CVR administration, diligence protocol, RWI relationships. You cannot build that infrastructure on the fly at Lilly’s pace.
The IPO Market as a Parallel Signal
Thirteen biopharma IPOs raised $5.0 billion in H1 2026 — topping every full-year total from 2022 through 2025. This is not just an interesting footnote to the M&A data. It is a market health signal. When both the M&A exit channel and the IPO exit channel are simultaneously active, the venture and biotech ecosystem has the confidence to advance development programs and make long-duration bets. That produces the pipeline of de-risked Phase 2/3 assets that feeds future M&A deal flow. The strength of the IPO market in H1 is a leading indicator for H2 and 2027 M&A pipeline quality, not just a measure of current sentiment.
China-Origin Licensing at Scale
The China-origin deal flow that was building in Q1 continued and expanded in Q2. AstraZeneca’s licensing of obesity candidates from CSPC Pharmaceutical for up to $18.5 billion is the single largest China-origin deal announced this year. Combined with the Hengrui-BMS $15.2 billion partnership and the Innovent-Pfizer $10.5 billion collaboration from earlier in the year, the total value of China-origin deals in H1 alone exceeds $44 billion. In 2025, 40% of all assets in-licensed by big pharma had a Chinese licensor. That figure is on pace to increase in 2026. The legal implications of China-origin deal flow — IP chain of title, export control, CFIUS, manufacturing site risk — are covered in our May 2026 pieces on deal legal infrastructure and due diligence and remain fully in force.
A NOTE ON METHODOLOGY AND HONEST REPORTING
The range of H1 2026 figures in circulation — from $96B to $170B — reflects genuine methodological differences, not error. A newsletter that picks the highest number to make the market sound more impressive, or the lowest to appear conservative, is not serving its readers. The IQVIA $130B figure is the most consistent with this series’ prior benchmarks and the most analytically useful for year-over-year comparison. The BioWorld $170B figure accurately represents the broadest possible measure of deal activity. Both are true. Know which one you are using when you report to a board.
The July 31 Deadline: What Happens in 25 Days
This issue publishes on July 6. The Section 232 pharmaceutical tariff first effective date for the 17 Annex III companies — AbbVie, Amgen, AstraZeneca, BMS, Boehringer Ingelheim, Lilly, EMD Serono, Genentech, Gilead, GSK/ViiV, J&J, MSD, Novartis, Novo Nordisk, Pfizer, Regeneron, and Sanofi — is July 31. That is four days from publication.
Every CLO at those 17 companies should have completed the HTSUS classification exercise covered in our April 2026 Section 232 analysis. The floating rate mechanism — where the Section 232 tariff is reduced so the total cumulative rate equals 100%, not added on top of existing duties — should already be modeled into each product’s cost of goods calculation. The MFN/onshoring deal track should have been evaluated and a decision made. The CDMO contract review for tariff passthrough provisions should be complete.
The window for strategic response on the July 31 deadline has closed for the July 31 companies. Onshoring commitments and MFN pricing agreements required months of lead time that no longer exists. The only actions remaining in four days: confirming FTZ privileged foreign status for any in-transit inventory imported before July 31, verifying CDMO agreements have been amended for tariff passthrough obligations, and ensuring product classification is correctly documented so the right rate applies from Day 1. Those companies that prepared are ready. Those that did not will be paying tariffs while they catch up.
For all other companies, the September 29 effective date is 85 days out. That window is real but narrowing. The classification exercise that has been deferred needs to start this week, not next month.
The H2 Deal Landscape: Five Situations That Define the Rest of the Year
1. Merck and Revolution Medicines
The reported Merck evaluation of Revolution Medicines — at a range of $28 billion to $32 billion — is still live as of this publication. Revolution’s lead programs target RAS-driven cancers through a pan-RAS inhibitor and a SOS1 inhibitor combination approach. A Merck/Revolution deal at the reported range would be the largest single pharma acquisition since AbbVie’s $63 billion Allergan transaction in 2019 and would represent Merck’s fourth major acquisition in roughly 18 months. The legal complexity of a transaction at that scale — HSR process, financing structure, MAC definition, diligence scope, integration planning — is everything this newsletter has addressed across ten issues simultaneously. If it closes, it defines H2.
2. The Section 232 Supply Chain Restructuring Wave
The tariff structure is producing a secondary M&A dynamic that did not exist before April 2: CDMO platforms with U.S. manufacturing capacity are becoming strategically critical assets. A specialty pharma company that relies on offshore API manufacturing for products facing the 100% tariff rate — and that cannot negotiate an MFN pricing deal or qualify for the onshoring reduced rate — faces a cost of goods problem that is material and ongoing. Acquiring a U.S. CDMO relationship, a U.S. manufacturing platform, or a co-development agreement with a U.S.-based manufacturer addresses that problem structurally. Multiple PE-backed CDMO transactions are in the pipeline for H2 precisely because the tariff economics have changed the build-versus-buy calculation for API sourcing.
3. The Pending Deals Still in Process
Several $1 billion-plus deals announced in Q2 remain pending regulatory clearance as of July 6. GSK’s acquisition of Nuvalent and AbbVie’s acquisition of Apogee Therapeutics are both subject to ongoing regulatory review and shareholder approval. Each pending deal adds to the H2 closing volume regardless of whether any new deals are announced. The closing pipeline from Q2 announcements alone supports a meaningful H2 deal value total even at a slower announcement pace.
4. The FDA Approval Calendar
H2 2026 carries a dense FDA approval calendar. Novo Nordisk’s CagriSema decision is expected in Q4 — the GLP-1/amylin combination that produced strong Phase 3 weight loss data. Intellia plans to complete its rolling BLA submission for lonvo-z (the potential first FDA-approved in vivo CRISPR gene editing therapy) in H2, setting up a potential early 2027 launch. Each major approval — particularly in GLP-1, gene therapy, or oncology — historically produces acquisition activity within 60-180 days in adjacent programs. The approval calendar is a leading indicator for H2 deal flow, not just a regulatory events list.
4B. Early July — The Market Has Not Paused
In the three weeks since H1 closed, deal activity has not slowed. Novartis announced the acquisition of Myricx Bio on July 6 for up to $1.5 billion ($1.1 billion upfront plus milestones), targeting a novel myristoylation inhibitor platform in oncology. Ipsen made two moves: the acquisition of Kartos Therapeutics for up to $1.75 billion (navtemadlin, an MDM2 inhibitor for myelofibrosis) and the acquisition of Memo Therapeutics. Zymeworks announced plans to acquire Theravance Biopharma for its COPD commercial asset Yupelri. The BioBucks live tracker, updated July 12, shows 52 control transactions for 2026 with the largest non-U.S. transactions including Recordati’s approximately $12.4 billion consortium acquisition, the Organon/Sun Pharma deal at $11.75 billion enterprise value, and Merck KGaA’s $11.3 billion acquisition of Bio-Techne. The market that produced a record H1 has not paused to catch its breath in the first three weeks of July.
5. The Macro Brake Risk
The market has three risks that could slow H2 from matching H1’s pace. The first is interest rate volatility — deal financing costs have remained manageable, but any unexpected rate increase compresses PE-backed deals and increases the cost of large strategic acquisitions financed with debt. The second is a major clinical failure in a high-visibility program — a Phase 3 miss in a category that has been driving deal premiums (GLP-1, orexin, RAS oncology) would reprice the relevant therapeutic area and pause deal activity in that space while the market recalibrates. The third is MFN pricing negotiation complexity: if the Section 232 MFN commitments required for the 0% rate create commercial constraints that larger pharma companies find unworkable, you could see a pause in deal activity among the Annex III companies as they evaluate whether the tariff compliance structure is compatible with their commercial models.
What This Data Means for the CLO Who Is Not at a Top-Ten Pharma Company
The H1 2026 record was built by a small number of very large acquirers making very large deals. Eli Lilly’s 11 deals. Five $10B+ transactions in Q2. The top five acquirers by deal value account for a disproportionate share of the aggregate. That concentration matters for the CLO at a mid-cap specialty pharma company or a PE-backed platform, because it tells you something specific: the assets that went to the large strategic buyers at premium valuations in H1 are no longer available. What is available for the rest of the market is what the large strategics passed over, what they bought incidentally and may now want to divest, and what has not yet completed enough clinical development to attract a $10 billion bid.
The opportunity set for smaller acquirers in H2 is real, but it looks different from what defined H1. It is earlier-stage clinical programs at Phase 1/2 that have not yet been de-risked enough for large pharma to pay full price. It is the carve-out transactions that will emerge from the integrations that are now just starting at Biogen, Lilly, and Merck. It is the non-auction bilateral processes that never make the BioWorld headline count. And it is the licensing deals that establish commercial rights without requiring the acquisition premium that is currently pricing smaller buyers out of control transactions.
The H1 deal record is someone else’s deal record. The H2 opportunity for the mid-market is a different market, playing a different game, requiring a different strategy.
laroccaj.substack.com | Subscribe: $40/month or $400/year
ABOUT THE AUTHOR
John LaRocca is a pharma and biotech attorney with 26 years of in-house experience, including CLO/GC tenures at Actavis, Eagle Pharmaceuticals, Aerie Pharmaceuticals, and Y-mAbs Therapeutics. He is the founding partner of LaRocca Advisory Group, a boutique fractional CLO services firm. The GC Playbook reflects his personal views and does not constitute legal advice.
© 2026 The GC Playbook|All rights reserved|Not for redistribution without p
Know a GC, CLO, or finance leader who’d find this useful? Forward it — genuinely, that’s how The GC Playbook grows.
And if your team has a raise, sale, or audit on the horizon, I take on a few diligence & compliance readiness reviews a year. Just reply to this email.
John (john@laroccaadvisory.com)
